Blog
- 30 May 2018 »
FDM Novice Waste
Abstract
Desktop‐grade fused deposition modeling (FDM) printers are popular because of compact sizes and affordable prices. If we are moving toward a future where desktop FDM printers are in every school and office, like conventional printers, then these machines will consume a large amount of energy and material. However, it is very difficult to evaluate the environmental impacts of FDM printers since there are so many different brands and types of printers using different raw materials under different scenarios. This study uses data from two different printing sites to evaluate the scenario and parameter uncertainty and variability in energy and material balances for FDM printers. Data from the two makerspaces provide insight into the material and energy consumption data using polylactic acid and acrylonitrile butadiene styrene (ABS) with four types of printers. The use of actual performance data allowed for the additional study of scrap ratio. Regressions provide insight into predictive factors for energy and material consumption. Monte Carlo simulations show the range of energy life cycle inventory values for the desktop‐grade FDM printers. From the regressions, Type A Pro was the most energy‐intensive machine. For material waste, an open‐access makerspace using ABS was associated with higher scrap ratio. Regression analysis indicates that the rate of material usage is not a strong predictor of waste rates. The amount of waste generated across both sites indicates that more ubiquitous access to FDM printing may create a significant addition to the waste stream.
- 30 Mar 2018 »
Trash-crete
In a recent paper, bulk and shear modulus are predicted for random assortments of mixed plastic waste embedded in concrete.
Abstract
Production and maker spaces are increasingly generating mixed plastic material waste of varying quality from 3-D printers. Industrial interest is growing in embedding granulated recycled particulate material additives into a virgin binding matrix. Examples include the introduction of granulated mixed recycled materials into 3-D printer material, concrete, and pavement. The stress load-sharing between the particulate additive and the binding matrix is an important factor in design and development of these composite materials. With mixed material additives, a designer is interested in the variation of such predicted load-sharing. However, experimental development is costly and time-consuming, thus analytical and semi-analytical estimates are desired for accelerated development. In this work, we expand on previous analytically correlated phase-averaged micro- and macrostructural loading to include variational effects present in mixed recycled material. In addition, model trade-offs are provided to aid designers in quickly selecting application specific mixtures. This framework identifies the stress contributions, and their variation, to reduce product development time and costs, which could greatly accelerate material recycling and reuse for improved infrastructure materials, low-cost 3-D printer filament, and reduced waste towards a more circular economy.
- 22 Feb 2018 »
Balanced Curls
Watching the 2018 Winter Olympics hosted in Pyeongchang inspired me to do a bit of analysis of curling. In this post we’ll examine the force balance of a moving stone as well as it’s trajectory without sweeping.
Without drag from the air and a level surface, I imagine a force acting on the stone with 2 components. The first is friction against the thrown direction of motion, the second is friction against rotation (curling).
The equation for the rotational frictional force acting on the stone becomes:
and for the linear friction:
where $\hat{i}$ represents the direction of the target area (positive east), and $\hat{j}$ represents the direction perpendicular to the target area (positive to the north).
The initial energy in the stone is a combination of linear and rotational kinetic values.
Both of these quantities are reducing due to the frictional forces acting upon the rock.
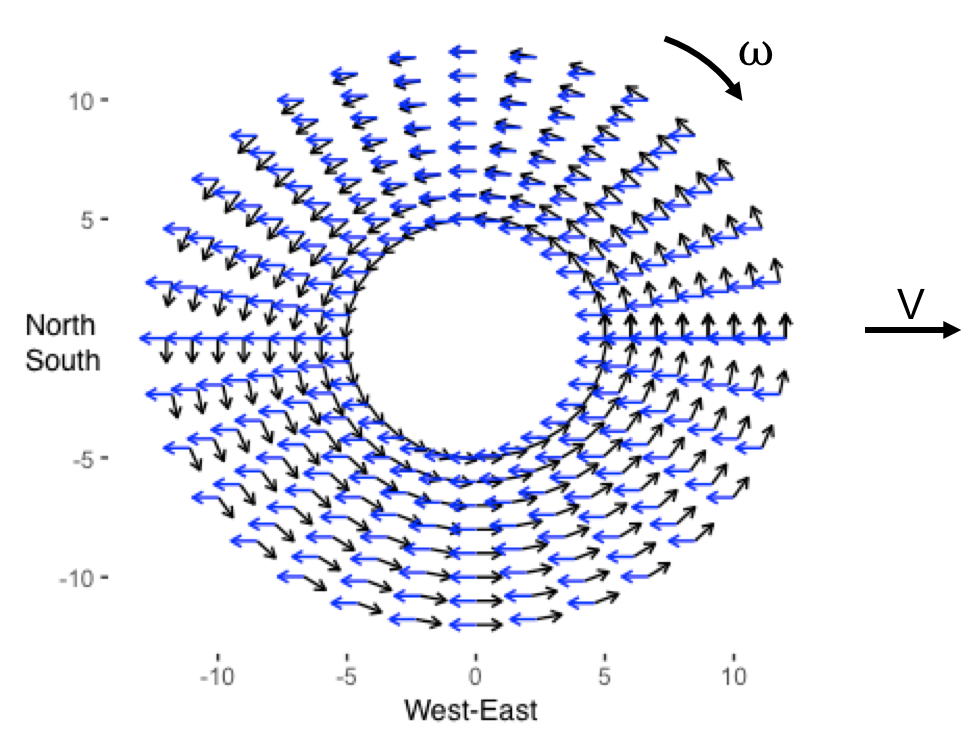
Plotting the surface tractions related to these forces gives a sense of what is going on around the stone. Notice at the center of the South side has two opposing forces.

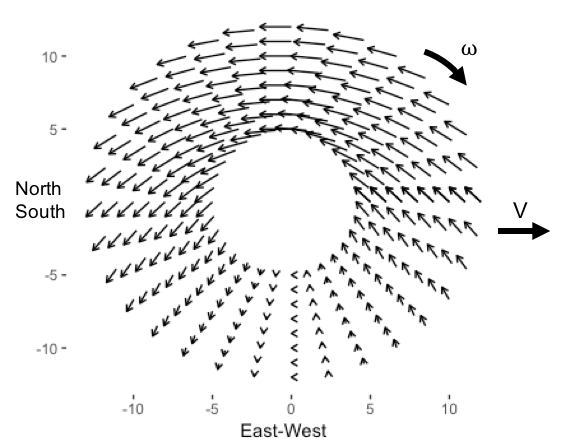
Computing the local combination of forces across the surface of the rock gives the following map:

A force balance of these components would suggest the north side of the stone would slow down faster than the south side and cause the rock to curve opposite the rotation direction.

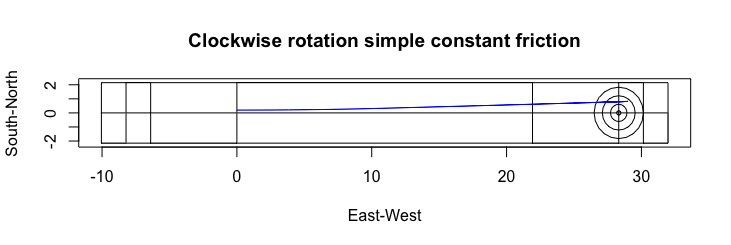
However, when you watch curling, the rocks curl in the same direction as the rotation. So, what is causing this trajectory?
To help solve this challenge, I’ll look at the interface of the ice and the rock.
The friction between the rock’s running band and the ice generates heat. This heat, along with the pressure of the rock melts the ice and alters the local coefficient of friction. I make a few simplifying assumptions about this mechanism and ignore local striations in the ice which could also contribute.
I define the coefficient of friction using polar coordinates and collapse the radial direction to a single distance. The local kinetic energy is assumed be the major factor generating heat and the reduction in friction coefficient is made proportional.
Next, I rotate the coefficient of friction around the rock with a lagging angle relative to the local kinetic energy.

- 02 Sep 2017 »
hi earth
Hello world!
Abstract
Desktop‐grade fused deposition modeling (FDM) printers are popular because of compact sizes and affordable prices. If we are moving toward a future where desktop FDM printers are in every school and office, like conventional printers, then these machines will consume a large amount of energy and material. However, it is very difficult to evaluate the environmental impacts of FDM printers since there are so many different brands and types of printers using different raw materials under different scenarios. This study uses data from two different printing sites to evaluate the scenario and parameter uncertainty and variability in energy and material balances for FDM printers. Data from the two makerspaces provide insight into the material and energy consumption data using polylactic acid and acrylonitrile butadiene styrene (ABS) with four types of printers. The use of actual performance data allowed for the additional study of scrap ratio. Regressions provide insight into predictive factors for energy and material consumption. Monte Carlo simulations show the range of energy life cycle inventory values for the desktop‐grade FDM printers. From the regressions, Type A Pro was the most energy‐intensive machine. For material waste, an open‐access makerspace using ABS was associated with higher scrap ratio. Regression analysis indicates that the rate of material usage is not a strong predictor of waste rates. The amount of waste generated across both sites indicates that more ubiquitous access to FDM printing may create a significant addition to the waste stream.
In a recent paper, bulk and shear modulus are predicted for random assortments of mixed plastic waste embedded in concrete.
Abstract
Production and maker spaces are increasingly generating mixed plastic material waste of varying quality from 3-D printers. Industrial interest is growing in embedding granulated recycled particulate material additives into a virgin binding matrix. Examples include the introduction of granulated mixed recycled materials into 3-D printer material, concrete, and pavement. The stress load-sharing between the particulate additive and the binding matrix is an important factor in design and development of these composite materials. With mixed material additives, a designer is interested in the variation of such predicted load-sharing. However, experimental development is costly and time-consuming, thus analytical and semi-analytical estimates are desired for accelerated development. In this work, we expand on previous analytically correlated phase-averaged micro- and macrostructural loading to include variational effects present in mixed recycled material. In addition, model trade-offs are provided to aid designers in quickly selecting application specific mixtures. This framework identifies the stress contributions, and their variation, to reduce product development time and costs, which could greatly accelerate material recycling and reuse for improved infrastructure materials, low-cost 3-D printer filament, and reduced waste towards a more circular economy.
Watching the 2018 Winter Olympics hosted in Pyeongchang inspired me to do a bit of analysis of curling. In this post we’ll examine the force balance of a moving stone as well as it’s trajectory without sweeping.
Without drag from the air and a level surface, I imagine a force acting on the stone with 2 components. The first is friction against the thrown direction of motion, the second is friction against rotation (curling).
The equation for the rotational frictional force acting on the stone becomes:
and for the linear friction:
where $\hat{i}$ represents the direction of the target area (positive east), and $\hat{j}$ represents the direction perpendicular to the target area (positive to the north).
The initial energy in the stone is a combination of linear and rotational kinetic values.
Both of these quantities are reducing due to the frictional forces acting upon the rock.
Plotting the surface tractions related to these forces gives a sense of what is going on around the stone. Notice at the center of the South side has two opposing forces.

Computing the local combination of forces across the surface of the rock gives the following map:

A force balance of these components would suggest the north side of the stone would slow down faster than the south side and cause the rock to curve opposite the rotation direction.

However, when you watch curling, the rocks curl in the same direction as the rotation. So, what is causing this trajectory?
To help solve this challenge, I’ll look at the interface of the ice and the rock.
The friction between the rock’s running band and the ice generates heat. This heat, along with the pressure of the rock melts the ice and alters the local coefficient of friction. I make a few simplifying assumptions about this mechanism and ignore local striations in the ice which could also contribute.
I define the coefficient of friction using polar coordinates and collapse the radial direction to a single distance. The local kinetic energy is assumed be the major factor generating heat and the reduction in friction coefficient is made proportional.
Next, I rotate the coefficient of friction around the rock with a lagging angle relative to the local kinetic energy.

Hello world!